Tracing
This article has examples in the following target languages:
- C
- C++
- Python
Tracing is a powerful tool when it comes to analysis and debugging of applications. Unfortunately, most tracing tools that are readily available are designed specifically for analyzing processes, threads and system calls. Specialized tools are required to enable analysis that is tailored to an alternative model of computation such as Reactors. The tools should be capable of understanding the fundamental concepts of the model, such as the distinction between logical and physical time, as well as structural units such as reactors and reactions. This page gives an overview of the currently supported trace mechanism, as well as an outline of alternative tools that could be useful in the future.
Tracing is different from logging. Logging produces human-readable output in textual form and incurs significant overhead. Tracing produces binary data that must be further processed to be useful and is designed to have minimal impact on the execution time of a program.
Tracing is currently supported in the C, Python, and C++ targets. The mechanism used in C and Python is different from that used in C++. Tracing in C++ requires third-party tools that may only be available in Linux. Tracing in C and Python does not require any third-party tools.
Default Tracing in C and Python
The default C and Python tracing mechanism depends only on the availability of the pthread library. Like C++ tracing, tracing is enabled by a target parameter:
target C {
    tracing: true
};
Once it is enabled, when the compiled program, say Foo.lf, is executed, a trace file is created, Foo.lft (the extension is for "Lingua Franca trace"). If you wish to customize the root name of the trace file, you can specify the following target property instead:
target C {
    tracing: {trace-file-name: "Bar"}
};
This will result in the trace file being named Bar.lft, regardless of the name of the .lf file.
The trace file is a binary file. It is not human readable. There are utilities for reading it:
trace_to_csv: This program creates a text file with one line per traced event in comma-separated list format.trace_to_chrome: This program creates a text file in JSON format that is suitable for reading into the same Google Trace Viewer, which runs in Google Chrome, as used above in C++ tracing.trace_to_influxdb: This program will send the traced event to a running InfluxDB database server.fedsd: This program creates a timed sequence diagram showing the interactions between components of a federated program (see Tracing Federated Programs below).
These four programs are located in reactor-c at lingua-franca/core/src/main/resources/lib/c/reactor-c/util/tracing. Running sudo make install in that directory will put executables into usr/local/bin.
Consider for example the ThreadedThreaded.lf test, which executes a number of heavyweight computations in parallel on multiple cores. If you enable tracing as shown above and run the program, a ThreadedTheread.lft file will appear. Running
trace_to_csv ThreadedThreaded
will create a file called ThreadedThreaded.csv that looks like this:
Event, Reactor, Reaction, Worker, Elapsed Logical Time, Microstep, Elapsed Physical Time, Trigger, Extra Delay
Schedule called, a, 0, 0, 0, 0, 704000, a.t, 0
Schedule called, a, 0, 0, 0, 0, 704000, a.t, 200000000
Schedule called, a, 0, 0, 200000000, 0, 177916000, a.t, 200000000
...
Reaction starts, a, 0, 1, 0, 0, 765000, NO TRIGGER, 0
Reaction ends, a, 0, 1, 0, 0, 765000, NO TRIGGER, 0
Reaction starts, t[0], 0, 1, 0, 0, 793000, NO TRIGGER, 0
Reaction ends, t[0], 0, 1, 0, 0, 177520000, NO TRIGGER, 0
Reaction starts, t[3], 0, 1, 200000000, 0, 177955000, NO TRIGGER, 0
Reaction ends, t[3], 0, 1, 200000000, 0, 348602000, NO TRIGGER, 0
The first line defines each of the columns. For example, the second line records a call to lf_schedule() for reactor named a, with no associated reaction, in worker thread 0, at (elapsed) logical time 0 with microstep 0. The call occurred at (elapsed) physical time
704 microseconds and is scheduling the trigger named a.t (a timer) with extra delay 0. This file can be imported into any spreadsheet program and sorted and analyzed.
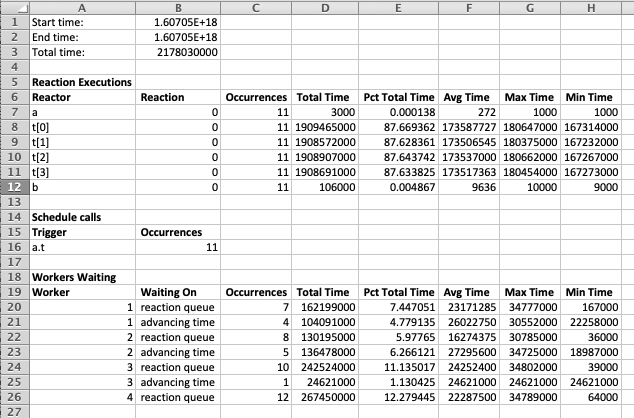
The trace_to_csv utility will also create a summary file called ThreadedThreaded_summary.csv that looks like this after importing in Excel:
If you call
trace_to_chrome ThreadedThreaded
then a ThreadedThreaded.json file is created. To visualize the data, point your Chrome browser to chrome://tracing/. Click on the Load button and select the .json file that you just created. The result should look something like this:
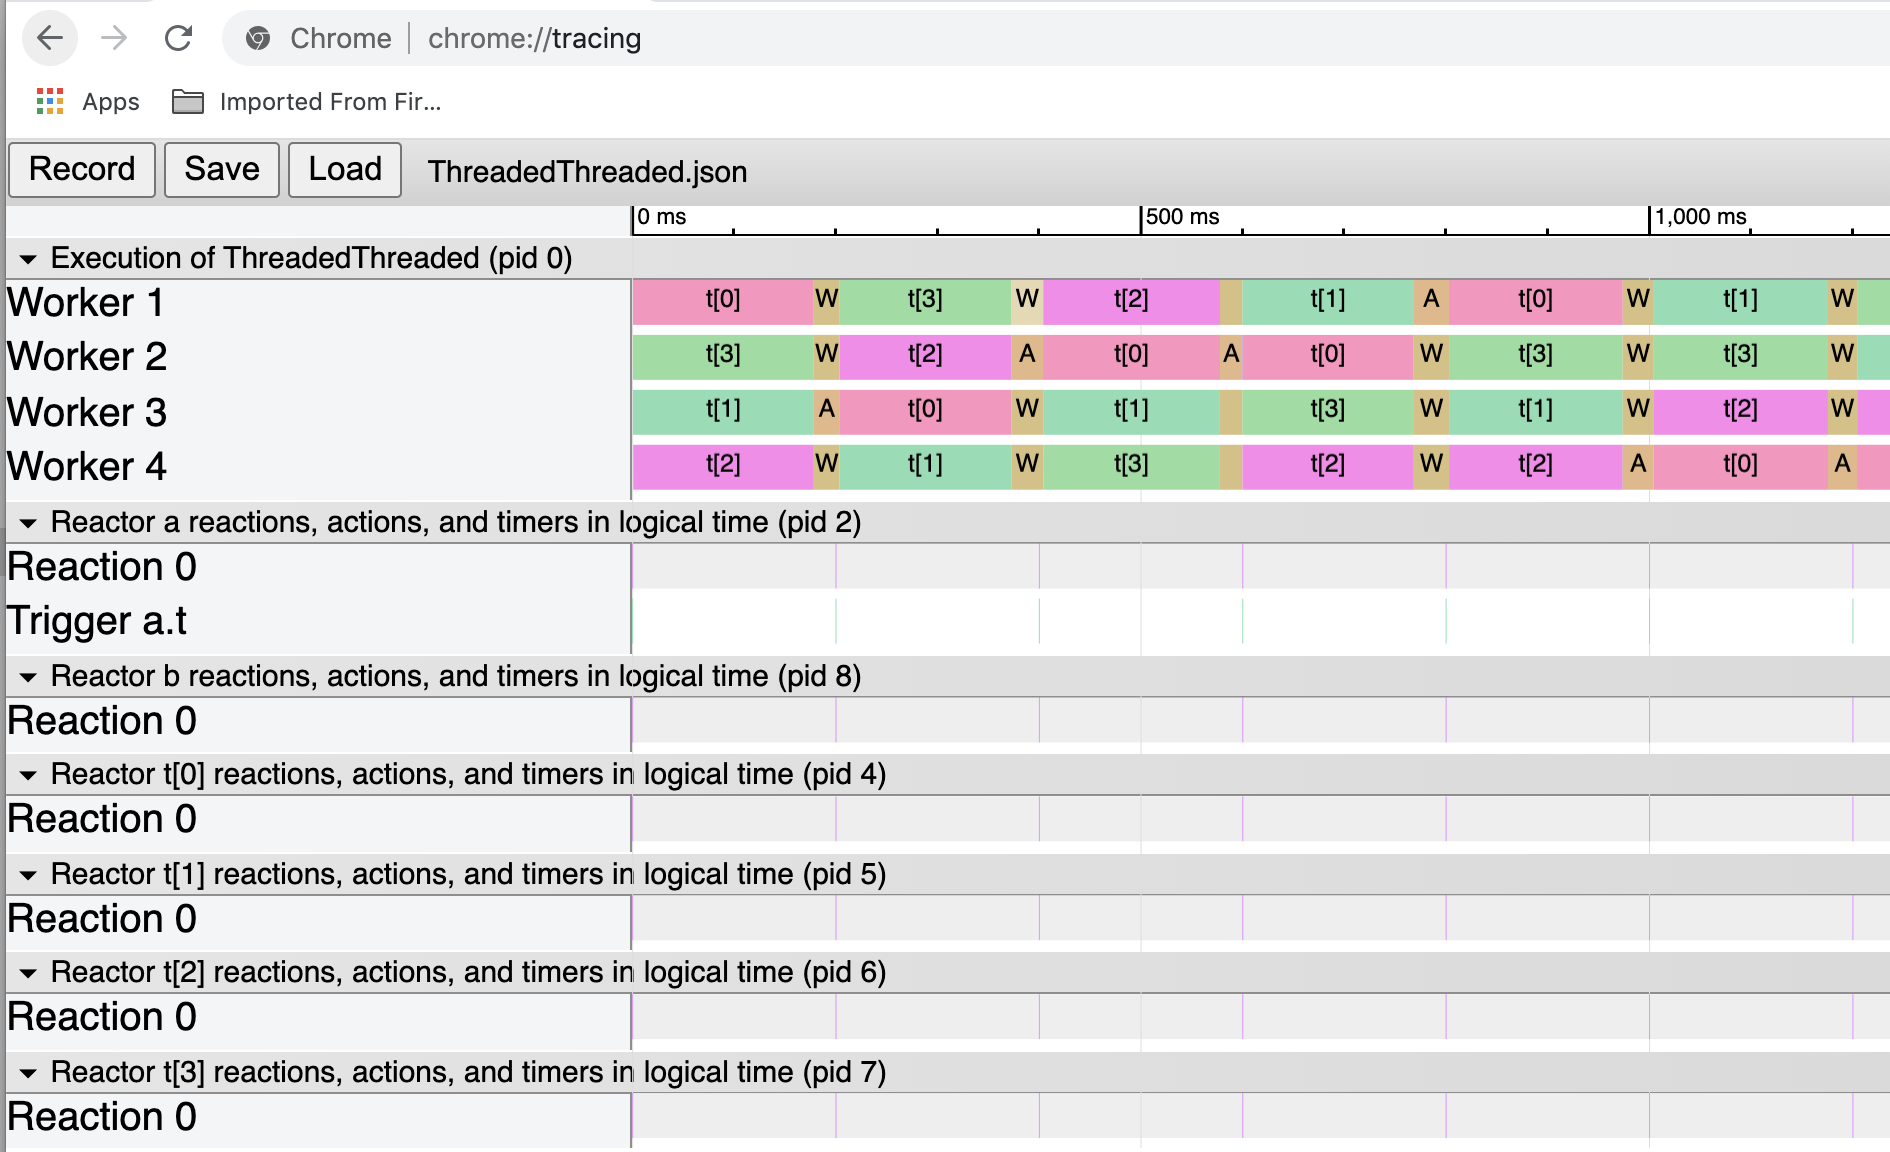
The tan-colored regions whose labels start with "A" and "W" represent time spent advancing logical time and waiting for activity on the reaction queue, respectively. When logical time advances, unless you have specified the -fast option, one of the worker threads blocks execution until physical time catches up with logical time. The remaining worker threads block waiting for reactions that are ready to execute appear on the reaction queue.
The JSON trace format can be found here. There is also a list of available color codes.
User-Defined Tracepoints
Users can add their own tracepoints in order to provide low-overhead recording of events and events with values that occur during the execution of reactions. To do this, the first step is to register the trace event in a startup reaction as follows:
    reaction(startup) {=
        if (!register_user_trace_event("Description of event")) {
            fprintf(stderr, "ERROR: Failed to register trace event.\n");
            exit(1);
        }
    =}
target Python {
  timeout: 2 sec,
  tracing: true
}
reactor Foo {
  # Handle for registered user trace event.
  state handle = 0

  reaction(startup) {=
    self.handle = self.register_user_trace_event("Description of event")
    if self.handle == 0:
      print("ERROR: Failed to register trace event.")
      exit(1)
  =}
}
The reaction to startup is designed to fail (exit(1)) if the tracing target parameter is not set to to true. If you wish to just ignore tracepoints if the target parameter is not set, then omit the exit(1) statement.
The description of the event is an arbitrary string, but the string must be unique. All events with the same description will be collected together in any display of events.
To then actually record an event, in a reaction, call tracepoint_user_event, passing it the same string. E.g.,
	reaction(in) -> out {=
	    ...
	    tracepoint_user_event("Description of event");
	    ...
	=}
To then actually record an event, in a reaction, call tracepoint_user_event, passing it the same handle returned by register_user_trace_event. E.g.,
	reaction(in) -> out {=
	    ...
	    self.tracepoint_user_event(self.handle);
	    ...
	=}
You can also pass a value to the trace. The type of the value is long long, so it can be a time value or an int. For example,
	reaction(in) -> out {=
	    ...
	    tracepoint_user_value("Description of event", 42);
	    ...
	=}
	reaction(in) -> out {=
	    ...
	    self.tracepoint_user_value(self.handle, 42);
	=}
An example of a Chrome display of a run of the Tracing regression test is here:
In this image, "Number of Destination invocations" is an event description to which values 1 through 10 were passed. This results in the shaded value plot shown first. The other four rows are just pure events (with no value). They are shown by (extremely) thin lines positioned at the physical time of the occurrence of the event. Dragging the mouse over those thin lines shows further details about the event in the window below.
Global User-Defined Tracepoints
Sometimes it is useful to define tracepoints that are global to the program, rather than local to a reactor. This can be done by defining the tracepoint in a startup reaction of the main reactor as follows:
main reactor {
  ...
  reaction(startup) {=
    global user_trace_event_id
    user_trace_event_id = self.register_user_trace_event("Global user trace event")
    if user_trace_event_id == 0:
      print("Failed to register user trace event.")
      exit(1)
  =}
  ...
}
Then, in any reaction, you can record the event by calling tracepoint_user_event or tracepoint_user_value, passing it the global tracepoint ID. E.g.,
  reaction(in) -> out {=
    ...
    global user_trace_event_id
    self.tracepoint_user_event(user_trace_event_id);
    self.tracepoint_user_value(user_trace_event_id, 42);
    ...
  =}
Tracing Federated Programs
When the tracing target parameter is set to true in a federated program, then each federate plus the RTI will generate a binary trace file. The utility fedsd generates an HTML file containing an SVG graphic that shows the messages exchanged between components over time. Like the other utilities, fedsd is defined in lingua_franca/util/tracing and installed using make install.
Consider the following LF program:
Setting tracing: true in this program and running it produces four .lft files. Running fedsd on those files:
fedsd
results in converting the files to .csv files and then generating a trace_svg.html file. Opening that file reveals a trace, the beginning of which looks like this:
This section of the trace shows only the initial negotiation for the start time for the federation. The vertical axis represents physical time, and the labels on that axis display physical time relative to the start time that is the result of this initial negotiation. The vertical axis is not linear so that more events can be displayed in a small space. The horizontal lines represent messages sent and received, with the message type and tag information (if any) shown.
A more interesting part of the trace is shown here:
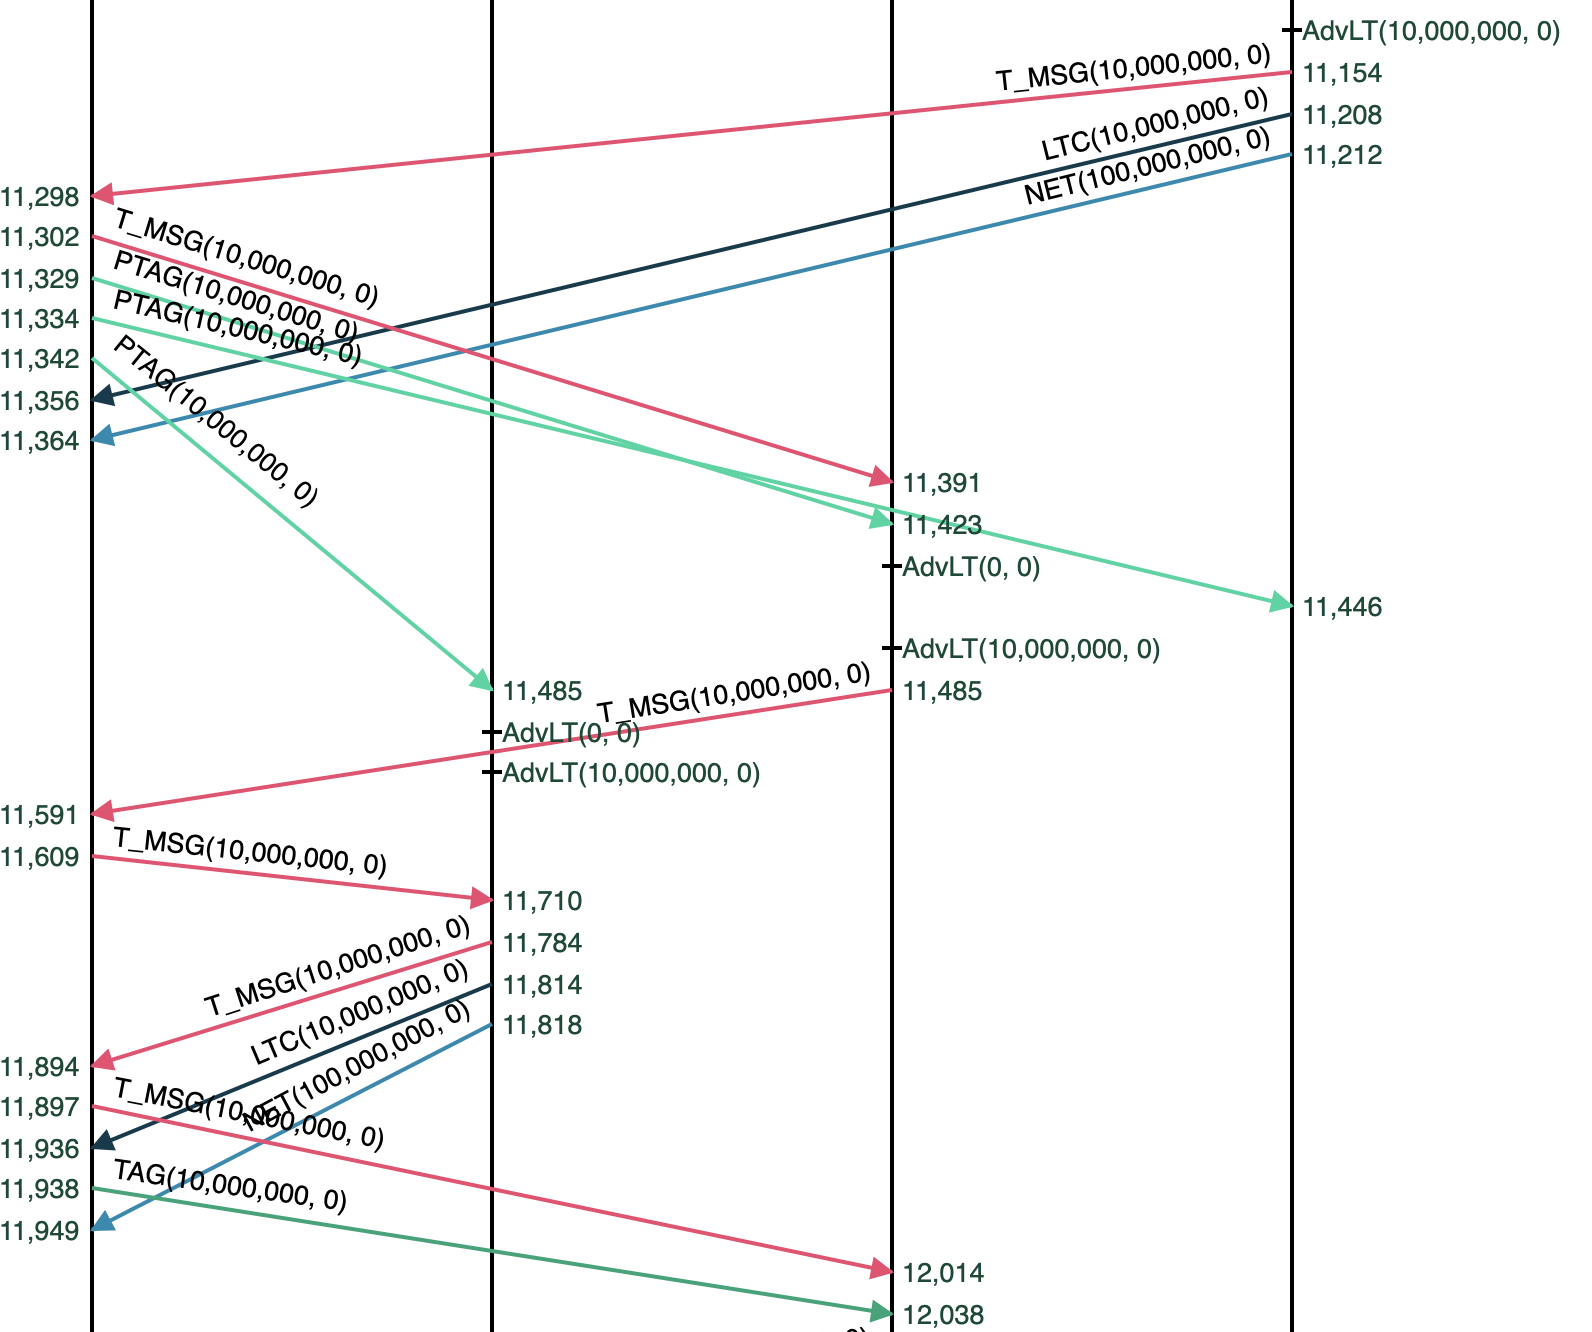
This shows f1 (on the right) advancing time to 10 ms, and sending a message (in red, via the RTI) to f2, which then forwards it to f3 (again, via the RTI).
Live Tracing in C via the Xronos Dashboard
In addition to the default file-based tracing described above, you can use the lf-trace-xronos plugin to stream live traces to the Xronos Dashboard using OpenTelemetry. This plugin provides real-time visualization of trace data without the need for post-processing.
To use the plugin, you need to build and install it, then configure your LF program to use it via the trace-plugin target property. Refer to the lf-trace-xronos repository for detailed build instructions and usage examples.
Tracing in C++
Tracing in the C++ target of Lingua Franca is based on three third-party tools. LTTng is a Linux tool used to instrument the Lingua Franca program and to record traces in the CTF, which minimizes the overhead of instrumentation. Chrome (or Chromium) has a build in trace viewer that is used to visualize the recorded trace data in a reactor-specific way. Since the Chrome trace-viewer cannot read CTF traces directly, we use Babeltrace2 to convert the recorded CTF trace to a JSON file that the Google trace viewer can load.
Usage
Some helper scripts that we will use below, can be found in the reactor-cpp repository.
-
Build and install the user space tools of LTTng (lttng-ust) as described here. On Arch, there is a community package available
pacman -Sy lttng-ust. On Ubuntu, you need to installlttng-tools,lttng-modules-dkms, andliblttng-ust-dev -
Build and install Babeltrace2 and its python bindings as described here. In most cases, the following steps should work:
git clone --branch v2.0.4 git@github.com:efficios/babeltrace.gitcd babeltrace./bootstrap./configure --prefix=/path/to/preferred/install/location --enable-python-bindings --disable-debug-info --disable-man-pagesmake install
-
Make sure babeltrace is available on your path:
export PYTHONPATH=${PYTHONPATH}:/path/to/preferred/install/location/lib/python3.8/site-packagesexport LD_LIBRARY_PATH=${LD_LIBRARY_PATH}:/path/to/preferred/install/location/lib
-
Modify the target declaration of your Lingua Franca program to enable tracing:
target Cpp {
    tracing: true
};
- Build the Lingua Franca program. The current build process is not very robust and does not automatically rebuild the reactor-cpp framework with tracing support if an earlier build exist. Be sure to remove all build artifacts
rm -r bin build include lib share src-genbefore triggering a new build. Alternatively, if you compile withlfc, you can add-cto the command to clean before building. - Start a LTTng user space session by simply running the
start_tracing.shscript. This will print the directory in which the recorded traces will be placed. - Run your instrumented Lingua Franca application.
- Stop the LTTng session using
stop_tracing.sh. - Convert the recorded CTF trace to a JSON file using
ctf_to_json.py <lttng-session-dir>.<lttng-session-dir>is the output directory reported bystart_tracing.sh. By default, this produces a filetrace.json. Optionally, the default output file can be overridden using-oor--output. - Open Chrome (or Chromium) and go to
about://tracing. Load the previously generated JSON file to visualize it.
The Trace View

The trace visualization consists of two parts. The upper part (labeled Execution), shows the physical time at which reactions are executed by the scheduler or by its worker threads. The lower parts show the reactors of the program. For each reactor, all scheduled actions (red markers) and all triggered reactions (blue markers) are visualized by their logical time. All elements in the trace view can be clicked on to display more detailed information.
Supporting Tracing in Other Targets
The same mechanism as described above can be used to trace Lingua Franca applications in other target languages. The key is to instrument the target runtime in order to produce CTF traces. LTTng comes with support for multiple languages. As a fallback solution, C can be used to define the trace points which then can be used from the target language through a foreign function interface. It should also be considered, to use an alternative library in the target language that is capable of producing CTF traces. The only requirement is that the generated CTF events have a similar structure, as it is currently used in the C++ target. See trace.hh in reactor-cpp to get an overview of the available trace points.
Trace Viewers
This section gives a brief overview of trace viewers that could be applicable for tracing Lingua Franca applications.
Google Trace Viewer
The Google Trace Viewer is the only viewer currently supported. Since it reads JSON files, it is easy to use and a conversion script can easily tailor the trace data such that it is correctly displayed by the viewer. Documentation of the JSON trace format can be found here. There is also a list of available color codes. The approach of using LTTng for tracing, a converter and Google Trace Viewer can also be used to sample and visualize data live. This is shown in the Scalapus project.
Trace Compass
Trace Compass is based on Eclipse and has native support for CTF traces. Due to the Eclipse support, Trace Compass is a natural candidate for integration with the Lingua Franca IDE. However, Trace Compass is tailored for the visualization of kernel traces or running user processes. Out of the box, it cannot make sense of reactor traces. There are various ways to customize Trace Compass in order to properly display the data, but they are difficult to use and/or not well documented.
- Custom trace analysis and views can be defined in an XML format. This probably works well for smaller tasks, but programming a mildly complex analysis in XML without proper error checking and debugging appears ridiculous.
- Custom analysis and views can also be programmed in scripting languages such as Python or Java Script. However, the tools seem not to be ready for production. I was not able to get the Python support working. Using Java Script the tools worked for simple tasks, but I was not able to come to a satisfactory results due to lack of or incomplete documentation and low customizability.
- Writing a Trace Compass Plugin. This seems to be the most promising approach, but probably requires a considerable amount of work. Writing such a plugin and integrating it with the Lingua Franca IDE could be a nice student project though.
Vampir
Vampir is another powerful tracing tool that is mainly developed at TU Dresden. It targets mostly HPC applications, and I am not sure if it can be adjusted to display specific information other than details of processes and threads.
Default Tracing in C and Python
The default C and Python tracing mechanism depends only on the availability of the pthread library. Like C++ tracing, tracing is enabled by a target parameter:
target C {
    tracing: true
};
Once it is enabled, when the compiled program, say Foo.lf, is executed, a trace file is created, Foo.lft (the extension is for "Lingua Franca trace"). If you wish to customize the root name of the trace file, you can specify the following target property instead:
target C {
    tracing: {trace-file-name: "Bar"}
};
This will result in the trace file being named Bar.lft, regardless of the name of the .lf file.
The trace file is a binary file. It is not human readable. There are utilities for reading it:
trace_to_csv: This program creates a text file with one line per traced event in comma-separated list format.trace_to_chrome: This program creates a text file in JSON format that is suitable for reading into the same Google Trace Viewer, which runs in Google Chrome, as used above in C++ tracing.trace_to_influxdb: This program will send the traced event to a running InfluxDB database server.fedsd: This program creates a timed sequence diagram showing the interactions between components of a federated program (see Tracing Federated Programs below).
These four programs are located in reactor-c at lingua-franca/core/src/main/resources/lib/c/reactor-c/util/tracing. Running sudo make install in that directory will put executables into usr/local/bin.
Consider for example the ThreadedThreaded.lf test, which executes a number of heavyweight computations in parallel on multiple cores. If you enable tracing as shown above and run the program, a ThreadedTheread.lft file will appear. Running
trace_to_csv ThreadedThreaded
will create a file called ThreadedThreaded.csv that looks like this:
Event, Reactor, Reaction, Worker, Elapsed Logical Time, Microstep, Elapsed Physical Time, Trigger, Extra Delay
Schedule called, a, 0, 0, 0, 0, 704000, a.t, 0
Schedule called, a, 0, 0, 0, 0, 704000, a.t, 200000000
Schedule called, a, 0, 0, 200000000, 0, 177916000, a.t, 200000000
...
Reaction starts, a, 0, 1, 0, 0, 765000, NO TRIGGER, 0
Reaction ends, a, 0, 1, 0, 0, 765000, NO TRIGGER, 0
Reaction starts, t[0], 0, 1, 0, 0, 793000, NO TRIGGER, 0
Reaction ends, t[0], 0, 1, 0, 0, 177520000, NO TRIGGER, 0
Reaction starts, t[3], 0, 1, 200000000, 0, 177955000, NO TRIGGER, 0
Reaction ends, t[3], 0, 1, 200000000, 0, 348602000, NO TRIGGER, 0
The first line defines each of the columns. For example, the second line records a call to lf_schedule() for reactor named a, with no associated reaction, in worker thread 0, at (elapsed) logical time 0 with microstep 0. The call occurred at (elapsed) physical time
704 microseconds and is scheduling the trigger named a.t (a timer) with extra delay 0. This file can be imported into any spreadsheet program and sorted and analyzed.
The trace_to_csv utility will also create a summary file called ThreadedThreaded_summary.csv that looks like this after importing in Excel:
If you call
trace_to_chrome ThreadedThreaded
then a ThreadedThreaded.json file is created. To visualize the data, point your Chrome browser to chrome://tracing/. Click on the Load button and select the .json file that you just created. The result should look something like this:
The tan-colored regions whose labels start with "A" and "W" represent time spent advancing logical time and waiting for activity on the reaction queue, respectively. When logical time advances, unless you have specified the -fast option, one of the worker threads blocks execution until physical time catches up with logical time. The remaining worker threads block waiting for reactions that are ready to execute appear on the reaction queue.
The JSON trace format can be found here. There is also a list of available color codes.
User-Defined Tracepoints
Users can add their own tracepoints in order to provide low-overhead recording of events and events with values that occur during the execution of reactions. To do this, the first step is to register the trace event in a startup reaction as follows:
    reaction(startup) {=
        if (!register_user_trace_event("Description of event")) {
            fprintf(stderr, "ERROR: Failed to register trace event.\n");
            exit(1);
        }
    =}
target Python {
  timeout: 2 sec,
  tracing: true
}
reactor Foo {
  # Handle for registered user trace event.
  state handle = 0

  reaction(startup) {=
    self.handle = self.register_user_trace_event("Description of event")
    if self.handle == 0:
      print("ERROR: Failed to register trace event.")
      exit(1)
  =}
}
The reaction to startup is designed to fail (exit(1)) if the tracing target parameter is not set to to true. If you wish to just ignore tracepoints if the target parameter is not set, then omit the exit(1) statement.
The description of the event is an arbitrary string, but the string must be unique. All events with the same description will be collected together in any display of events.
To then actually record an event, in a reaction, call tracepoint_user_event, passing it the same string. E.g.,
	reaction(in) -> out {=
	    ...
	    tracepoint_user_event("Description of event");
	    ...
	=}
To then actually record an event, in a reaction, call tracepoint_user_event, passing it the same handle returned by register_user_trace_event. E.g.,
	reaction(in) -> out {=
	    ...
	    self.tracepoint_user_event(self.handle);
	    ...
	=}
You can also pass a value to the trace. The type of the value is long long, so it can be a time value or an int. For example,
	reaction(in) -> out {=
	    ...
	    tracepoint_user_value("Description of event", 42);
	    ...
	=}
	reaction(in) -> out {=
	    ...
	    self.tracepoint_user_value(self.handle, 42);
	=}
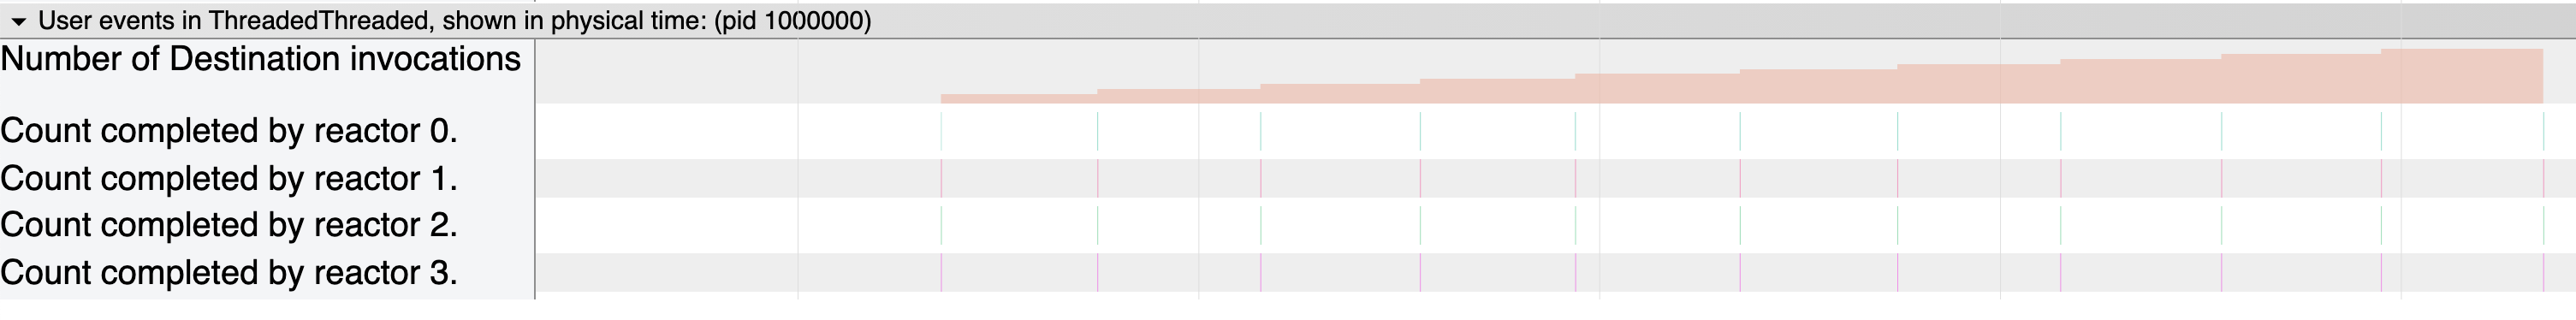
An example of a Chrome display of a run of the Tracing regression test is here:
In this image, "Number of Destination invocations" is an event description to which values 1 through 10 were passed. This results in the shaded value plot shown first. The other four rows are just pure events (with no value). They are shown by (extremely) thin lines positioned at the physical time of the occurrence of the event. Dragging the mouse over those thin lines shows further details about the event in the window below.
Global User-Defined Tracepoints
Sometimes it is useful to define tracepoints that are global to the program, rather than local to a reactor. This can be done by defining the tracepoint in a startup reaction of the main reactor as follows:
main reactor {
  ...
  reaction(startup) {=
    global user_trace_event_id
    user_trace_event_id = self.register_user_trace_event("Global user trace event")
    if user_trace_event_id == 0:
      print("Failed to register user trace event.")
      exit(1)
  =}
  ...
}
Then, in any reaction, you can record the event by calling tracepoint_user_event or tracepoint_user_value, passing it the global tracepoint ID. E.g.,
  reaction(in) -> out {=
    ...
    global user_trace_event_id
    self.tracepoint_user_event(user_trace_event_id);
    self.tracepoint_user_value(user_trace_event_id, 42);
    ...
  =}
Tracing Federated Programs
When the tracing target parameter is set to true in a federated program, then each federate plus the RTI will generate a binary trace file. The utility fedsd generates an HTML file containing an SVG graphic that shows the messages exchanged between components over time. Like the other utilities, fedsd is defined in lingua_franca/util/tracing and installed using make install.
Consider the following LF program:
Setting tracing: true in this program and running it produces four .lft files. Running fedsd on those files:
fedsd
results in converting the files to .csv files and then generating a trace_svg.html file. Opening that file reveals a trace, the beginning of which looks like this:
This section of the trace shows only the initial negotiation for the start time for the federation. The vertical axis represents physical time, and the labels on that axis display physical time relative to the start time that is the result of this initial negotiation. The vertical axis is not linear so that more events can be displayed in a small space. The horizontal lines represent messages sent and received, with the message type and tag information (if any) shown.
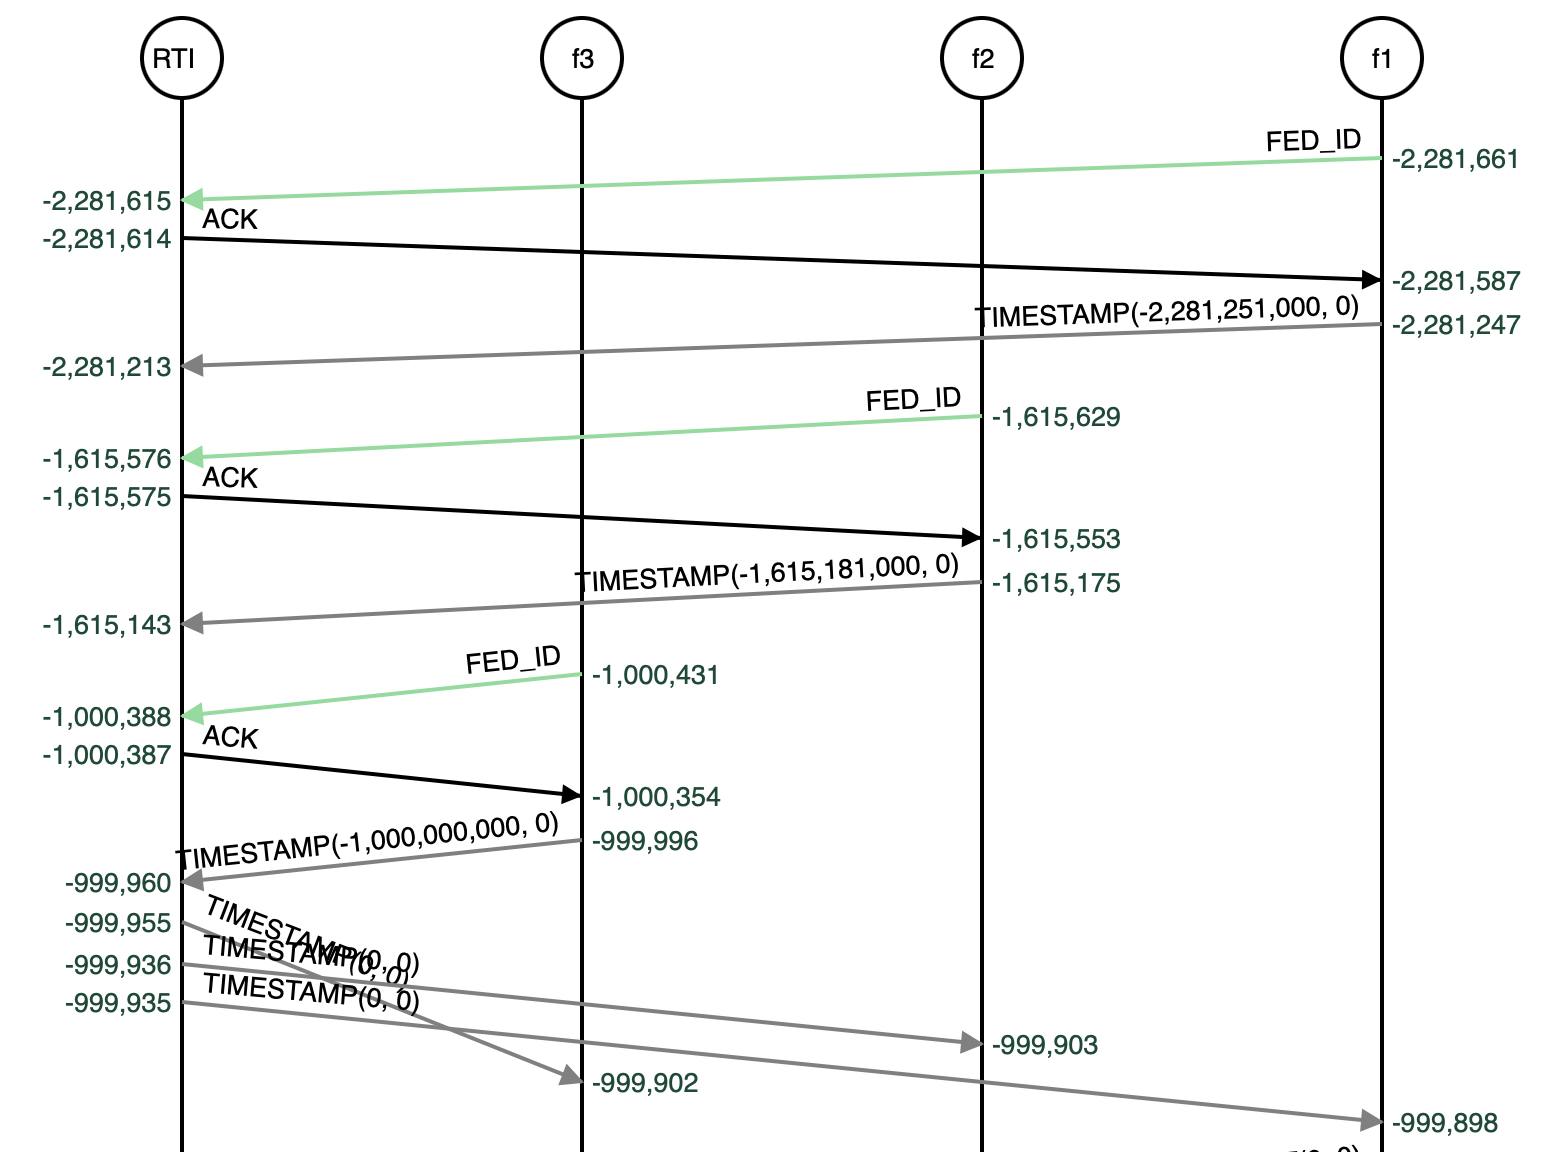
A more interesting part of the trace is shown here:
This shows f1 (on the right) advancing time to 10 ms, and sending a message (in red, via the RTI) to f2, which then forwards it to f3 (again, via the RTI).
Live Tracing in C via the Xronos Dashboard
In addition to the default file-based tracing described above, you can use the lf-trace-xronos plugin to stream live traces to the Xronos Dashboard using OpenTelemetry. This plugin provides real-time visualization of trace data without the need for post-processing.
To use the plugin, you need to build and install it, then configure your LF program to use it via the trace-plugin target property. Refer to the lf-trace-xronos repository for detailed build instructions and usage examples.